Waveform analysis of a representative song.
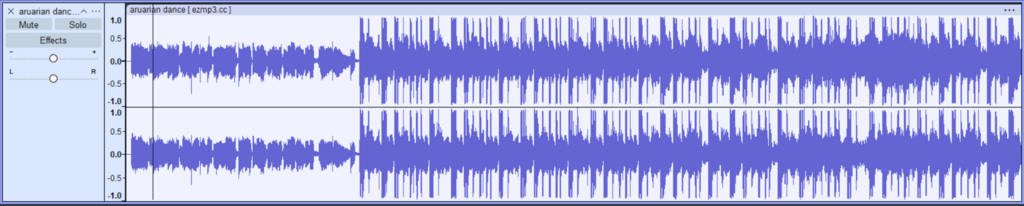
The full waveform reveals key Lo-Fi characteristics:
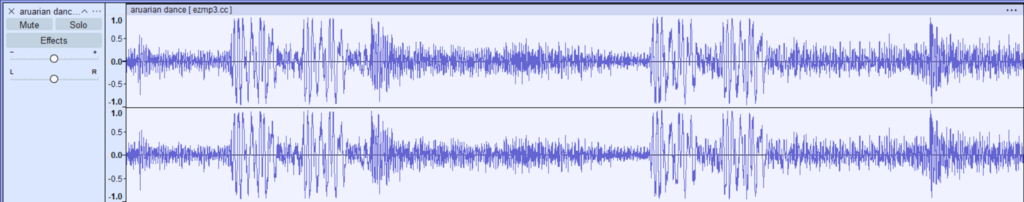
This close-up view reveals the envelope characteristics that define Lo-Fi percussion and instruments:
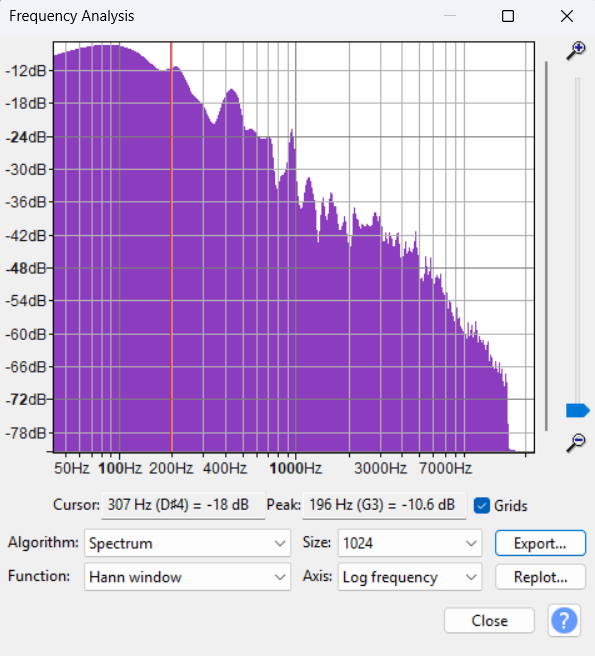
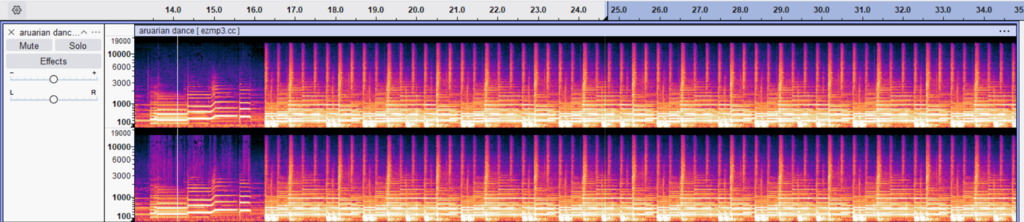
The frequency analysis demonstrates classic Lo-Fi frequency treatment:
This frequency profile is deliberately engineered to create a sound that can be listened to for extended periods without causing listening fatigue.
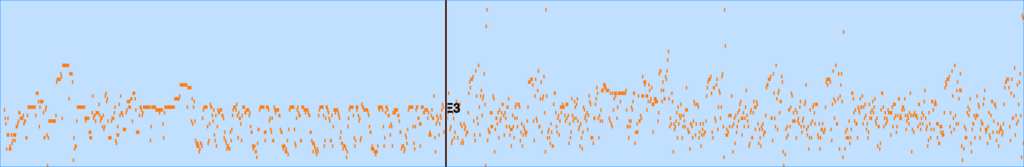
The spectrogram reveals the time-based frequency characteristics:
Analysis of the most common notes in the song.
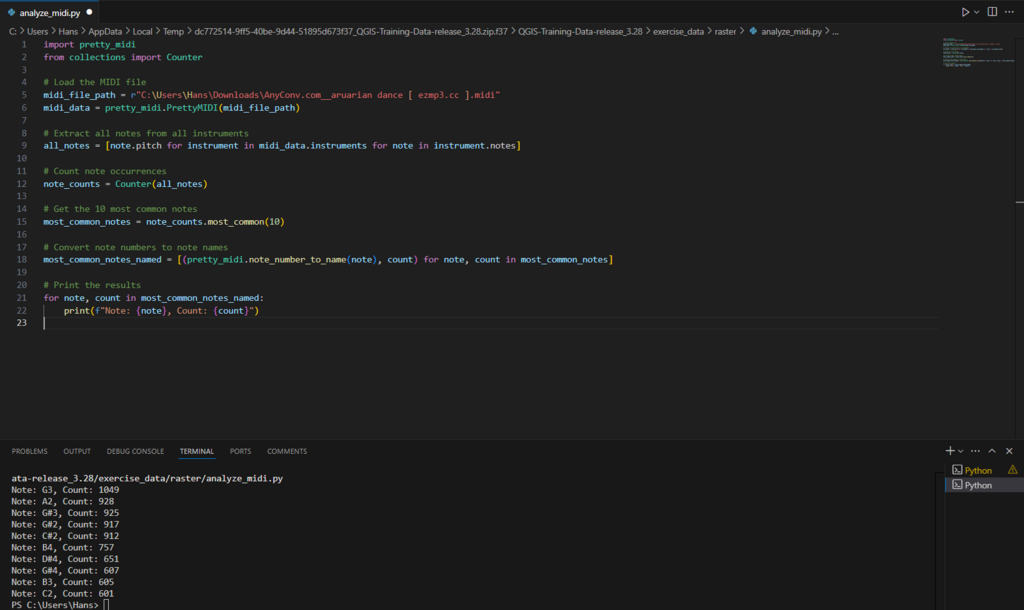
Most common notes:
Note: A2, Count: 928
Note: G#3, Count: 925
Note: G#2, Count: 917
Note: C#2, Count: 912
Note: B4, Count: 757
Note: D#4, Count: 651
Note: G#4, Count: 607
Note: B3, Count: 605
Note: C2, Count: 601
This close-up view reveals the envelope characteristics that define Lo-Fi percussion and instruments: